
Marketing Science
Professional Exam
study guide
FEBRUARY 2025 VERSION

Table of contents

Overview 03
Assess 04
Hypothesize 16
Recommend measurement solutions 25
Perform an analysis 38
Generate insights 64
Make data-driven recommendations 73
Glossary 86
Overview

Meta Certification can help you get noticed.
Meta Certification recognizes advanced-level proficiency with Facebook, Instagram and Messenger.
Certification is the highest level of accreditation that Meta recognizes in digital marketing.

Help boost your resume, credibility and career.
This document will help prepare you for the Meta Certified Marketing Science Professional Exam, which measures your competency in using data, insights and measurement to make informed marketing recommendations.
To learn more about the exam, visit the Marketing Science Professional Certification website. Find answers to frequently asked questions and learn more about Meta Certification.


Assess

Before you begin data analysis or run any experiments, it’s critical you understand what question you and your stakeholders hope to answer. When you establish this question up front, you're better able to make actionable marketing decisions.
The first step in your assessment should be to clearly define the business goal and the KPIs that can best help you evaluate how successfully you achieved that goal. Clearly defined business goals enable you to determine whether the metrics your analysis or experiment has focused on are the right ones.
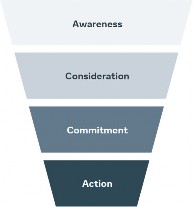
Goals vary by business and industry depending on numerous internal and external factors. Not every business, for example, has an immediate goal to achieve a certain amount of revenue or profit. Sometimes, a goal may be higher in the marketing funnel, such as brand awareness, or lower, such as conversion. As an analyst, your role is to know what the data or experiment can and cannot measure. Let’s look at two examples of goals from Axion to determine which is more effective.
The best-defined business goals follow a rubric: they are specific, measurable, achievable, relevant and time-bound, or SMART. If you define a business goal that is non-measurable or lacks specificity, strategic decisions will become increasingly complex and less effective. Once you decide on a business goal, you’ll need to determine the KPIs that will measure the success of your campaign. KPIs make clear what outcome will be measured to evaluate your success. But KPIs are more than metrics— they tell a story about what is happening in a business at the time of measurement.
To identify your KPIs, ask yourself:
What does success look like?
Are my current metrics proxies or do they correlate with business outcomes?
Goal | Increase sales by 10% in 2021 | Increase app installs by 10% in Q4 | Increase ad recall by 5 points in Q1 | Generate new leads in Q1 |
KPI |
Number of sales units |
Number of mobile app installs |
Ad recall lift |
Number of submitted forms |
Primary KPIs | Secondary KPIs | |
What is it? | The overall business objective that ad spend is being measured against. It might be the primary question that the business is trying to answer. | Support primary KPIs. They are important business objectives that ad spend can be measured against to better contextualize the primary KPI. |
Example | Ad recall lift | Ad recall lift in a specific target audience caused by video campaigns |
While KPIs are important, they have limitations. To evaluate the limitations of a KPI, identify:
Measurable business objectives | Which business objectives might not be measurable with available tools, such as non-traceable tender, and therefore cannot be valid KPIs. |
Primary and secondary KPIs | Which KPIs are actually primary vs. secondary. Ensure focus on the primary and don’t switch between KPIs mid-campaign. |
Accurate measurement | Whether the amount of available data for a specific metric is enough to provide an accurate measurement of a proposed KPI. If not, evaluate switching to a different KPI or moving to a different proxy metric. |
Metrics make a KPI measurable with data. A metric can be a number or a ratio, and you can both estimate and observe it. The metrics you choose should align with your business goals, just as your KPIs do. It’s easy to confuse KPIs and metrics, but there's an important distinction: All KPIs are metrics, but not all metrics are KPIs.
While experiments can measure incremental value, they’re not necessarily practical in every scenario. When experiments do suit your situation though, you have many different metrics from which you can choose.
It's important to ensure the metrics you track actually measure your business results. While likes, shares and comments may be useful in some cases, those types of interaction don’t necessarily indicate success. Consider real business outcomes instead, such as sales, which reflect your bottom line.
For example, people who like or comment on a paid ad may be no more likely to purchase or convert. This means that an ad with lower engagement doesn't necessarily mean that the ad was ineffective. Similarly, you shouldn't necessarily devalue people who don't engage with your ads. For these reasons, it's important to choose the metrics that matter most to your business goals.
Let’s look at some metrics you may want to focus on.
For upper-funnel brand metrics, such as awareness, you may want to measure ad recall or incremental reach.
For consideration, you could focus on page views or content downloads.
For commitment, you might find it's valuable to measure website visits, sign-ups or app events.
For action, you could measure action intent or conversions.
Not all of these are important to each campaign. For example, if an organization needs to increase revenue, an increase in website visits may not be a sign of success, but an increase in conversions is.
In short, choose metrics that matter.
Metrics for measuring KPIs can vary by channel. For example, you may find that the KPI and metrics you've selected to align with a particular business goal all exist on one platform.
However, due to variations in measurement solutions across channels, it's impossible to measure that KPI with the same accuracy on another channel. Each channel has its own measurement limitations, and those limitations can impact the metrics you want to track for a KPI.
For example, imagine you want to measure total incremental purchases across your entire marketing strategy for an upcoming campaign. Two of the channels you're using have solutions to measure incremental conversions, but the third doesn't. In this case, you should evaluate whether there's a way to approximate the measurement of incremental conversions for the third channel. If there's no accurate way to measure it, consider a different KPI you're able to effectively measure that reflects your goal.
Once you have your business goals and KPIs defined, assess your existing data sources. Data sources can capture and report KPI data with accuracy and timeliness. A data source is a tool, connection, piece of code or other object that collects information that can later be measured and analyzed.
The data and data sources you choose to use should depend on the KPI you want to measure. With Meta tools, the data you’re able to include in your analysis often depends on which data sources your client or business has implemented.
To assess your data strategy, ask yourself:
Which data sources are best suited to your success metrics?
Which data sources are in place, and what data do you have access to?
First-party data is the data that a business collects directly from its customers, and it might include, for example, website activities and sales data. Third-party data is data that a party with no direct relationship with the customer collects, such as a data management provider.
Within these categories, there are different types of data you can use for analysis. Let’s look at four of them.
Information about actions people take on your website, in your mobile app and in your stores.
Data from tests or experiments such as the incremental impact of your campaign.
Data from Meta campaign performance, such as what you’d see in Ads Manager.
Data about marketing performance overall, such as what you’d see in a marketing mix model (MMM).

There are a few Meta data sources that can help you capture the necessary data for your measurement analysis in ways that support the privacy choices people make.
The Meta Pixel enables you to track whether people take certain actions on your website after they see your ads on Meta technologies. You can also use it to create Custom Audiences or lookalike audiences for strategic targeting and to optimize campaign delivery to people likely to convert on your website.
The Conversions API is another tool to help you share website activity data with Meta. Unlike the Meta Pixel, which relies on browser cookies, the Conversions API enables you to share data directly from your server, rather than through a browser. It also respects the privacy choices of people who don’t want their data shared.
There are currently several industry changes that are likely to degrade ad performance, such as shifts in the regulatory landscape for data sharing and browser updates that block third-party cookies by default. However, the Conversions API can help you mitigate any losses that may occur as a result of these changes.
The Facebook SDK enables you to track whether people take certain actions in your app after they see your ads on Meta technologies. You can also use the SDK to create Custom Audiences or lookalike audiences for strategic targeting and to optimize campaign delivery to people likely to convert in your app.
With the App Events API, you can send app events for measurement, targeting and optimization, without necessarily having to update or add app code, which may be necessary when you implement the SDK.
Lastly, the offline conversions API is a tool that enables you to track whether people take actions offline after they see your Meta ads (for example, in-store purchases linked to a loyalty program). The tool shares this hashed information directly from the client server with Meta. You can also use the offline conversions API to create Custom Audiences or lookalike audiences for strategic targeting and to optimize campaign delivery to people who are likely to take action offline.
Think of these data sources as a means of painting a picture that, when you use them together, can create the most value.
For example, when you combine pixel implementation with the Conversions API or advanced matching, the two together can help paint a more complete picture of your funnel. When you consider data from a variety of sources, you can better understand the journey and reach people at the right time.
Not all data and data sources are equal. It’s rare to receive a perfect set of data from your clients, so the ability to work with data that's abnormal can help you conduct analyses or make recommendations. Let’s explore a few data basics.
Variables
A variable is an element, feature or factor that's likely to vary or change. Choose variables that are specific, measurable and aligned with your business goal to help ensure that your outcomes give you the most relevant, useful information. This helps you to better understand why a metric moved and determine the connection between that variable and the change you've observed.
Granularity
Granularity refers to the level of detail in the data set. Differences in data granularity may require reconciliation before you can conduct an analysis or make a recommendation.
For example, you could see a difference in the increments of time, such as weeks versus days. There could also be mismatched geographic data across different regions. For example, one data set might organize post codes or ZIP codes, while another might organize by city or market areas.
It’s important to note that different platforms can also count metrics differently. One platform might count a video viewed after two seconds, while another platform may count it from the very start. Each of these cases requires some reconciliation in the data to perform an analysis.
Outliers refer to observations in a data set which appear to be inconsistent with the rest of that set. Potential ways you can address outliers include:
Analyze data without them
The inclusion and omission of the outliers can change the outcome or interpretation of your analysis, so check it both ways. If the sample size is large enough, the omission of an outlier may not affect the analysis. If the outcome of your analysis changes though, you can use median analysis to replace the outliers.
Down-weigh them
You might also down-weigh the outlier in your analysis with a weighted average instead of a normal average. This gives the outlier less influence over your analysis.
Adjust the sample size
If the sample size is large enough, you can adjust it. You can use a trimmed mean, which is a method of averaging that removes a small percentage of the largest and smallest values before you calculate the average. Alternatively, you can calculate the Winsorized mean. To calculate the Winsorized mean, replace the highest and lowest values with the data point closest to them.
Remove them (with caution)
Removal of the outliers from your data set is possible, but you should only do it after thorough consideration, especially if you don’t know what caused it.
Like other data points in your analysis, outliers can also tell a story, and their removal may skew your analysis. Also, outliers can be valuable data points, because they can tell us something different from our central model. It's therefore important to analyze them. Outliers offer potential information about the data, so while they might be a measurement mistake, the data might actually have a factor that's unknown to the analyst that underlies the distribution. If it doesn't, pay close attention to it.
The other thing you may encounter is missing data. There are many ways to deal with missing data, and it can get complicated depending on the case.
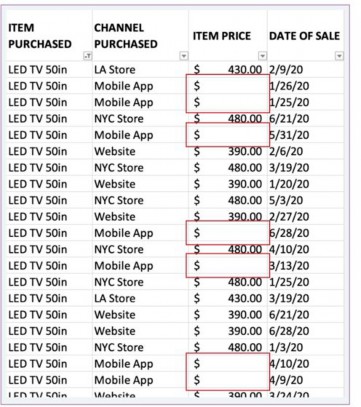
For a simple example, let’s look at the sales data of a fictitious electronics company, Axion. Imaging the price of the 50-inch LED TV differs across channels, and you can’t just ask the client to look up the price. What are some potential ways to address this?
There are several ways to deal with missing values, and it depends on the analysis you’re doing, the analytics tool and access to more information.
In this case, we could simply use the mean or median value to input the item price on a mobile app.
Understanding the types of data sources and data available is foundational to choosing an appropriate measurement methodology. Consider the different methodologies that can be used to measure impact. Below, we define the measurement methodologies and review the limitations of each.
Method | Description | Limitations |
A/B test | A test that enables you to test different versions of your ads against each other, so you understand which elements achieve the best performance based on your current attribution settings. This test is ideal for businesses that just want to learn which tactics work best to optimize future campaigns. In general, A/B tests are highly effective for routine tactical optimizations. |
|
Randomized control trial (RCT) | RCTs test a hypothesis by introducing a treatment, studying the effects and determining the impact of your ad. Ultimately, an RCT can help you decide how much to spend on each marketing channel to maximize your results. It can infer causality. |
|
Observational method | A measurement method in marketing research that observes the effect of ads on people without changing who is exposed to the ads. |
|
Each combination of data type and methodology requires a statement of assumptions in order to correctly assess the situation at hand. Identify whether business objectives are being measured in a way that is compatible with Meta’s measurement tools and whether there are any potential data blind spots.
For example, if you are measuring online conversions, make sure you have the correct data source in place (Meta pixel) and it is implemented correctly. If you do not have a Meta pixel on your website, then you will not be able to use Attribution or Lift solutions
Hypothesize

To run an effective experiment, you should first choose a hypothesis, or question, that you want your experiment to answer. A strong, well-structured hypothesis can be confirmed or rejected through testing and can lead to valuable insights.
A hypothesis is an idea or explanation that you can test through study and experimentation. A strong hypothesis includes:
Who: audience
What: behavior of that audience
Where: location
When: ad schedule
Why: the rationale for the anticipated audience behavior or perspective
In order to develop a hypothesis, you need to first determine a variable and then apply research and industry context.
Examples of variables | |
Audience Placement
Creative: format, message, quantity of ads
Delivery optimization
Campaign objective
Account structure
Budget
Frequency
Example hypothesis 1 | |
An ecommerce clothing company’s goal is to increase online purchases. In May, they launch their summer line and hypothesize that lifestyle-focused creative will achieve more online purchases than value-focused creative among the 18-34 age group. | |
Who: people ages 18-34
What: purchase
Where: online
When: May
Example hypothesis 2 | |
A CPG/FMCG advertiser’s goal is to increase brand awareness for a new hair-care product among a broad global audience of women over the age of 25 between June and August. The advertiser seeks to test the hypothesis that a 10-second video format on Facebook and Instagram would increase brand awareness more effectively than their current 30-second videos. | |
Who: women over the age of 25
What: brand awareness
Where: Facebook and Instagram
When: June through August
A test hypothesis is a proposed explanation for an observation you can test, usually in the form of an if/then statement. While a hypothesis could be a subjective assumption, a test hypothesis includes a null and an alternative hypothesis. The objective is to test if the null hypothesis can be rejected and the alternative can be accepted.
Identify the independent variables and dependent variables.
Ensure variables are specific, measurable and aligned with your business goal.
You can test multiple variables at once, but advertisers should test one variable at a time if the goal is to understand and isolate the effect of the strategy being tested.
Identify a null and an alternative hypothesis to understand exactly what is being tested.
Example test hypothesis | |
If an advertiser increases the number of ad placements from 1 to 4 or more, their average cost per acquisition (CPA) will decrease. | |
Null hypothesis: Alternative hypothesis: | |
Independent variable = the number of ad placements
Dependent variable = CPA
CPA (1 placement) = CPA (4 placement)
CPA (1 placement) < CPA (4 placement)
Once you have a hypothesis, prove or disprove it by gathering existing insights or research or conducting a test. Choose from the following measurement approaches:
Cross-channel reach reporting
Attribution
Marketing mix modeling
Randomized control trial (RCT)
A/B test
Cross-channel reach reporting | |
Measures how channels work together to generate business outcomes. Channels include but are not limited to email, TV, direct mail, Facebook and paid search. | Limitations |
| |
Example of cross-channel reach reporting | |
Context | A CPG advertiser runs ads on multiple platforms, including TV and digital channels, with the goal of reaching a broad audience at an efficient cost per person. |
Hypothesis | The advertiser seeks to test the hypothesis that investment in TV delivers more efficient reach relative to their digital channels. |
Measurement approach | The advertiser uses cross-channel reach reporting to test this hypothesis. |
Attribution | |
The process of determining credit for each touchpoint on a consumer’s path to conversion. Multi-touch attribution models, or MTAs, allocate value to more than one touchpoint in a consumer’s path to conversion. Data-driven attribution is the process of determining credit for touchpoints on a conversion path often based on historical data and statistical modeling | Limitations |
| |
Example of Attribution | |
Context | An advertiser running prospecting and retargeting campaigns on Facebook and Instagram sought to increase return on ad spend (ROAS) from their Facebook and Instagram advertising during their highest sales period. They do not want to have a holdout on their media during this time. |
Hypothesis | They seek to test the hypothesis that their prospecting campaigns deliver less incremental value than their retargeting campaigns but cannot run an experiment at this time. |
Measurement approach | They use our data-driven attribution model to assess the estimated incremental value of these campaigns in the interim. |
Marketing mix modeling | |
A data-driven statistical analysis that quantifies the incremental sales impact and return on investment of marketing and nonmarketing activities, measuring both offline and online sales across channels. | Limitations |
| |
Example of Marketing mix modeling | |
Context | An agency wants to optimize spend across channels for a soda brand. The soda brand client delivers media on TV, email, direct mail, Facebook and other digital channels. |
Hypothesis | The agency hypothesizes that TV achieves a higher ROI than direct mail, and therefore more budget should be allocated to TV next year. |
Measurement approach | Instead of looking at the impact of each channel in a silo, a marketing mix model helps to understand the effect of each channel on sales outcomes in the previous year. |
Randomized control trial (RCT) | |
An experiment designed to measure causality. It includes randomization of participants into mutually exclusive groups. One or more of these groups receive the treatment called the test group, while one or more do not receive the treatment, called the control groups. The control provides a standard of comparison and can represent a standard practice, a placebo or no treatment. | Limitations |
| |
Example of Randomized control trial (RCT) | |
Context | An advertiser running ads on multiple channels, including Facebook, wants to measure the sales caused by their Facebook advertising in order to assess the accuracy of their current attribution model. |
Hypothesis | The advertiser hypothesizes that their Facebook advertising achieves $500,000 in incremental sales and a $50 cost per incremental purchase in the month of June. |
Measurement approach | They run a randomized control trial experiment to measure the causal impact of their Facebook advertising. |
A/B test | |
Testing multiple campaigns against one another to see which tactical approach produces the best results based on your KPIs. | Limitations |
| |
Example of A/B test | |
Context | An advertiser running ads in Feed on Facebook only wants to reduce their average CPA. |
Hypothesis | They seek to test the hypothesis that incorporating Instagram Feed as an additional placement along with Feed on Facebook would reduce their average CPA. |
Measurement approach | They run an A/B test to measure the cost per result from both strategies. |
Once you’ve validated or invalidated your hypothesis, determine the possible actions for the outcomes and recommend appropriate next steps. For example, if your hypothesis was validated, you might test a new hypothesis. You might find that your insights will lead to new questions and new hypotheses that will be the foundation for new tests. It’s always a good idea to think about testing beyond what you have already tested.
Recommend measurement solutions

Meta measurement tools unlock the potential to optimize your ads, understand your audience and grow your business. Measurement solutions like Brand Lift and Conversion Lift tests can help your business find answers to many of the questions you have about ads with the help of rigorous scientific testing. Using randomized control groups, you’ll be able to see how much your Meta ads lead to conversions, which campaign causes the lowest-cost conversions and much more.
Meta offers a variety of solutions to test your hypothesis. You’re ready to design a test once you have the following:
A business goal
A primary KPI
A strong hypothesis
A variable to test

Audience
Test your ad against two different audiences. For example, an audience of people ages 18–25 versus an audience of people ages 26–35.

Creative
Test different images or creative elements against the same audience.

Placement
Test different ad placements or test your typical placement selections against Advantage+ placements.

Delivery optimization
Test different delivery optimizations against each other.

Budget
Test the effectiveness of different structures for your ad budgets.

Campaign objective
Test different campaign objectives to find which one best helps you achieve your desired results.
Use this type of test to test different treatments of one of the following variables:
When to use an A/B test | ||||
To determine | To perform | To see results | When you are | When looking for |
best practices | day-to-day | based on last ad | sure that baseline | a test that is easy |
tactical decision-making | attribution | levels between A and B groups are similar | and quick to set up | |
A marketing strategist at Wind & Wool, a fictitious fashion retailer, wants to test the impact of a “Learn More” call-to-action button, as compared to a “Shop Now” button. Both buttons direct the audience to the promotions page on their website. With an A/B test, Wind & Wool learns which text is more effective and uses that knowledge to refine their future campaign strategies.
Ad A
Group A
Best
performance
Group B
Ad B
Disclaimer: Wind & Wool is a fictitious business designed by Meta. Any similarities to content produced by real-life businesses aren't intentional. This example is for illustrative purposes only.
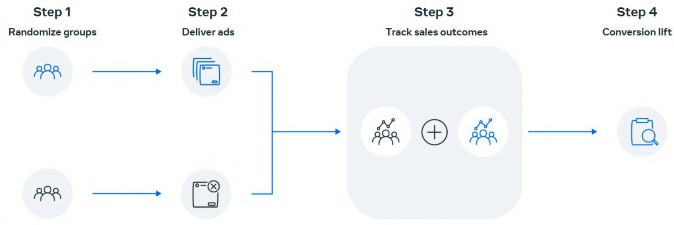
Effective measurement starts by understanding incremental business outcomes, such as brand equity and conversions, that your ads can affect. To measure the impact of your ads, lift solutions are utilized to randomize your audience into test and control groups with similar characteristics. The system then delivers ads to the test groups.
After the ads run, the system administers a poll or tracks sales outcomes for both the test and control group. Finally, the system compares poll results or sales outcomes from the test group of people who saw your ads against the control group of people who didn’t. This enables you to measure the incremental impact of your campaign.
When to use a Lift test | ||
To measure incremental outcomes by comparing actions of people who have seen your ad with people who haven’t | To see how Meta ads affects the outcome of your ads | To learn about cost per lift point, which allows advertisers to optimize their spend in the most efficient way possible |
Test group
Exposed to
variable
Hypothesis
Compare conversions between the two groups to determine the true incremental value of the strategy.
Control
group
Not exposed to
variable
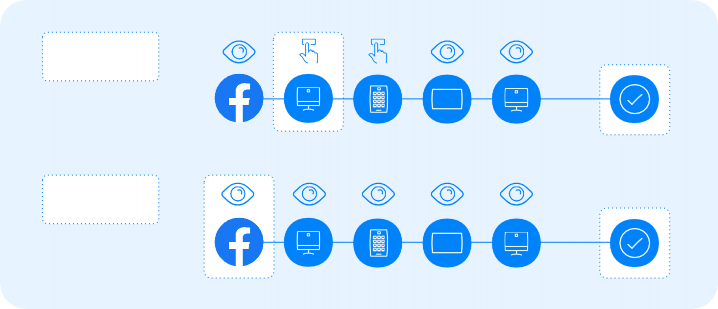
Lift tests with statistically significant results can infer causality and accurately measure incrementality, unlike proxy metrics, like clicks and likes, which are indirect approximate measurements that may not be correlated with actual business value and can result in suboptimal business decisions.
There are 2 types of lift tests: brand lift and conversion lift.
Brand Lift testing enables you to evaluate the awareness lift your campaign is responsible for. Brand Lift tests help you prove a causal relationship between your advertising and the results you observe. If we look back to our RCT methodology, the system delivers polls to both the test and the control groups.
This is how polling in the test appears on the platform. It also helps you prove a causal relationship between your advertising and the results you observe. These might involve brand favorability of product consideration. Each person in your test receives only one question randomly.
If someone is eligible to receive the poll question, the system shows it to them 4–48 hours after ad delivery.
Note: There's a seven-day polling eligibility window, which means that if the system serves a person a poll and that person doesn't respond, they're eligible to see the poll again seven days after exposure. That second one could be a different question than the original poll. This situation is only possible if the campaign runs longer than seven days.
Brand lift test example
Axion is a fictional electronics manufacturer that makes the most technologically sophisticated televisions in the world. Despite the fact that they sell a superior product, marketers with superior resources have eclipsed their efforts. The general target audience for Axion is people ages 18–45.
This is how the Axion team conducted the brand lift test.
First, they created the target audience for the campaign, and then their audience is divided into random, non-overlapping groups. This randomization helped ensure other factors wouldn't skew the results.
The system delivered the ads to the test group but not the control group.
Between 4–48 hours after the ad delivery occurred, Meta polled the test and control group audiences and showed one question, at random, to each person. Poll questions were about topics such as ad recall, brand awareness and message association.
To calculate lift, Meta compared the results in the test and control groups.
Disclaimer: Axion is a fictitious business designed by Meta. Any similarities to content produced by real-life businesses aren't intentional. This example is for illustrative purposes only.
Conversion lift test
Conversion lift tests are another form of randomized control trial test. These lift tests track sales outcomes. The difference in sales between the test group and control group is your conversion lift. Conversion lift tests enable you to prove a causal relationship between your advertising and the increases in conversions that you observe.
It’s important to note that you need to integrate conversion data with Ads Manager. You should therefore have the Meta Pixel, Facebook SDK or Conversions API installed to provide a data signal.
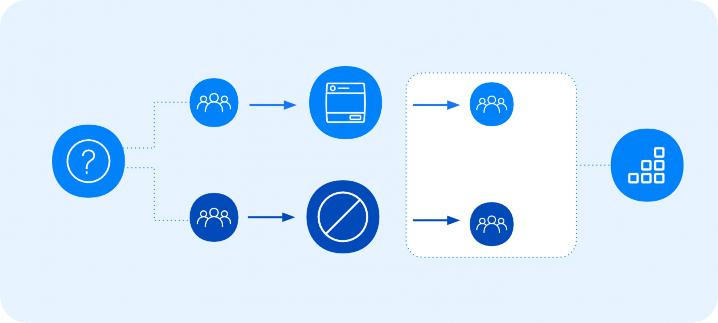
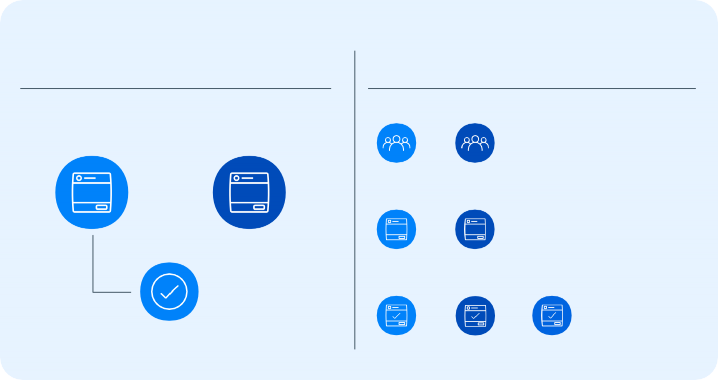
There are two ways to design your lift test:
Single-cell test | Multi-cell test |
This option is best used to get a baseline understanding of incremental brand or conversion outcomes your campaign is currently driving. | Compare two competing strategies to understand which leads to greater incrementality. |
Single-cell
How many incremental conversions does advertising on a platform achieve?
Multi-cell
Which strategy achieves more efficient incremental conversions?
Target A
Target B
Broad vs. narrow targeting
Ads on Facebook
No ads on Facebook
vs.
vs.
Creative 1
Creative 2
Influencer vs. brand
Feed vs. Stories
vs.
Freq. A
Freq. B
Freq. C
vs.
vs.
Was the buy frequency sufficient to deliver
creative impact?
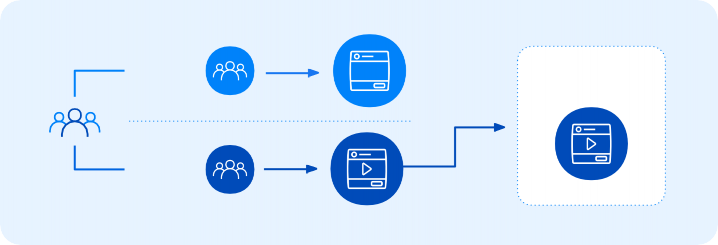
In general, keep lift tests as simple as possible. The more cells you add, the more complex the test becomes. You can also perform multiple tests. For example, you can use an A/B test to choose between two creatives, and in addition, a Conversion lift test to understand the incremental conversions that result from this new creative strategy.
You can choose from the following solutions to measure your ad performance.
Attribution | |
Strengths |
|
Limitations |
|
Outputs |
|
Example | An advertiser who uses a mix of prospecting and retargeting campaigns can track their consumer journey and attribute incremental value to all of their media touchpoints. This allows them to optimize budgets across publishers and tactics. |
Brand Lift | |
Strengths |
|
Limitations |
|
Outputs |
|
Example | An advertiser uses Brand Lift to understand which tactics result in the greatest awareness of its new line extension. |

For managed Brand Lift studies, work with an account representative to set up the tests.
Conversion Lift | |
Strengths |
|
Limitations |
|
Outputs |
|
Example | An advertiser uses Conversion Lift to understand which of its targeting audiences generates the greatest incremental ROAS. |
Marketing mix models (MMM) | |
Strengths |
|
Limitations |
|
Outputs |
|
Example | An advertiser wants to cut its marketing budget by 10% and uses MMM to decide where to direct the cuts. |
A/B test | |
Strengths |
|
Limitations |
|
Outputs |
|
Example | An advertiser hypothesizes that their ads get more engagement with Instagram Stories as compared to Instagram News Feed. They use an A/B test to understand which placement is more effective for their ads. |
Now that you’ve chosen an approach, there are several factors to consider when assessing the likelihood of success of your chosen measurement solution, including:
Potential reach | A larger holdout increases statistical power because it increases the size of the control group that you are comparing against. Look for a big difference between the test group and the control group. It’s harder to detect lift with a small control group. If you’d like to increase the statistical power, you can either increase the reach or the control group. Both actions will give you more chances to detect lift. Conversely, with smaller reach, you’ll have a smaller holdout and less statistical power. |
Budget | A higher budget can make for a more powerful test. Budget affects the media pressure to actually cause an effect, also called media weight. Although budget doesn’t technically affect statistical power, it does affect lift. If you spend more money, you’ll be able to expect a larger effect. If your test has a larger effect, it’s easier to detect lift. Because statistical power is the ability to detect lift, a greater budget will lead to greater statistical power. |
Data coverage and availability | Does the platform have the ability to tie orders from all channels, such as an app, a website or offline, to impressions? |
Time constraints | Consider whether your test duration aligns with best practices. For example, the ideal time frame for an A/B test is at least three days but no longer than 30 days. |
Technological constraints | For example, does the platform in question have the capability to run a Randomized control trial (RCT) test, such as a lift tool? |
Maximize measurement validity | Ensuring that your test is setup for success is a crucial step in any lift test. You may need to adjust the test and campaign parameters to maximize measurement validity. For example:
|
Perform an analysis

When performing an analysis, it’s important to use the right data, matched with the right methodology. To conduct statistical and data analyses, you need to interpret statistical outputs, consider validation metrics, create data visualizations and write a simple script or query to extract or manipulate data.
Statistical outputs help you to interpret the results of your analysis, while validation metrics allow you to measure the quality of the analysis. Together, they indicate how robust your data is.
Consider the value of each statistical output across different media channels and platforms. Almost every output has a validation metric, so it’s important to consider both when conducting an analysis. You can distinguish the value of statistical outputs across media channels and platforms through the validation metrics.
Review some examples of outputs and validation metrics in the graphic below.
Statistical outputs
Both

Validation
metrics
Regression coefficients
Slope and intercept
Mean, median, mode
Confidence Intervals
Bias and variance
Standard deviation (STDEV)
Correlation coefficient (R)
Standard errors (SE)
Mean error Log-likelihood P-values
R-squared Adjusted R-squared T-static
F-static Durbin-Watson
Variance inflation factor
Sample size
Given the validation metrics, recommend an attribution model.
Single-touch attribution models | Multi-touch attribution models | Data-driven attribution model |
First click or visit | Even credit | |
Last touch | Positional | |
Time decay |
First click
Visit
Single-touch attribution models give credit to only one touchpoint.
First click or visit | |
What it is | This model gives 100% of the credit for a conversion to the first click on the conversion path. |
How it’s used | Use this model to better understand how to value the first click or visit in a conversion path, especially when success is defined within a longer attribution window or a longer consideration period. It gives no credit to impressions or later touchpoints that could have incremental effects on your conversion rate, and may oversimplify conversion paths that rely on middle- and lower-funnel activity. If you want to understand and credit the full conversion path, consider even-credit, positional or time-decay attribution models. |
How it’s calculated | This model is a rules-based single-touch attribution model. It gives 100% of the credit for a conversion to the first click or visit in a conversion path. If a click and visit happen within 60 seconds of each other, then only the click is counted. |
Example | If a conversion path contained an impression first, then a click, and then a visit, the click would receive 100% of the credit for the conversion. If a conversion path contained an impression, then a click, and then a visit 30 seconds later, the click and the visit would count as the same touchpoint and get 100% of the credit for the conversion. |
Last touch (including last click) | |
What it is | This model gives 100% of the credit for a conversion to the last click, visit, impression or view that happened in a conversion path. If there is no click or visit, then this model credits the last impression. |
How it’s used | Use the last-touch model when you want to consider only the last touchpoints in a conversion path. For example, in a last-click attribution model, the last touch is a click. This model can help understand how to value the last touchpoint in a conversion path, especially when success is defined within a shorter attribution window or you have low-consideration conversions. This model does not give credit to earlier touchpoints that could have incremental impact, and may oversimplify conversion paths that rely on upper and middle-funnel activity like awareness and consideration. If your goal is to understand and credit the full conversion path, consider even credit, positional or time-decay attribution models. |
How it’s calculated | This model is a rules-based single-touch attribution model. It gives 100% of the credit for a conversion to the last click or visit that happened in a conversion path. If there is no click or visit, then it will credit the last impression. If a click and a visit happen within 60 seconds of each other, only the click is credited. |
Example | If a conversion path contained an impression first, then a click, and then a visit, the visit would receive 100% of the credit for the conversion. If the path didn’t contain a click or a visit, then the impression would receive 100% of the credit for the conversion. If a conversion path contained an impression first, then a click, and then a visit 30 seconds later, the click and the visit would count as the same touchpoint and get 100% of the credit for the conversion. |

Last touch Including last click

Even credit
Multi-touch attribution models take into account more than one interaction with a given media channel. They are inclusive of other models, including even credit, positional and time decay, which are explained below.
Even credit | |
What it is | This model considers the full conversion path and gives each touchpoint equal credit for a conversion, regardless of where it appeared on a conversion path or if it was an impression, click or visit. |
How it’s used | This model helps you understand how to value the first touchpoint that introduced the product, the middle touchpoints that build consideration and the last touchpoint that helped people get to the point of conversion. Typically, even-credit models are more illustrative than actionable, since it’s unlikely that all touchpoints are equally effective. Compared to a last-touch or last-click model, even credit better reflects how all touchpoints can lead to a conversion, and can inform your business decisions. If your goal is to understand and credit the full conversion path, consider positional and time-decay attribution models. |
How it’s calculated | This model is a rules-based multi-touch attribution model. It gives an equal credit percentage to each click, visit and impression on a conversion path. If there was one impression, three clicks and one visit on the conversion path, each one would share 20% of the credit for the conversion. |
Example | If a click and visit happen within 60 seconds of each other, then only the click is credited. If an impression and a click appear to be associated with the same ad and happen within 24 hours of each other, then they are counted as a single touchpoint when receiving credit for a conversion. |
Positional | |
What it is | This model gives a specific percentage of credit for a conversion to the first and last touchpoints in a conversion path, with the remaining credit distributed evenly across all intermediate touchpoints. This model considers the full conversion path, but gives weighted credit to the first and last touchpoints. |
How it’s used | This model helps you understand how to value the touchpoints that occurred first and last in a conversion path. This model typically values any middle touchpoints with less credit than the first and last. Compared with a last-touch or last-click model, positional better reflects how all touchpoints helped lead to a conversion while considering the important roles that the first and last touchpoints may have played. If your goal is to understand and credit the full conversion path, you should also consider even-credit and time-decay attribution models. |
How it’s calculated | This model is a rules-based multi-touch attribution model in which the first and last touchpoints are given a specific percentage of credit and the remaining credit is distributed evenly across all other touchpoints. The positional model is offered in two configurations, 30% and 40%, where either 30 or 40 percent of the credit is given to both the first and last touchpoints, with the remaining 40 or 20 percent of the credit distributed evenly among the remaining touchpoints |
Example | If you choose Positional 30%, and there are five touchpoints in your conversion path, the first touchpoint will receive 30% of the credit, the last touchpoint will receive 30% of the credit and the remaining three touchpoints will each get 13% of the credit. If a click and a visit happen within 60 seconds of each other, then only the click is credited. If an impression and a click appear to be associated with the same ad and happen within 24 hours of each other, then they are counted as a single touchpoint when receiving credit for a conversion. |

Positional
Time decay | |
What it is | This model gives an increasing percentage of credit for a conversion to touchpoints as they get closer in time to the conversion. This model considers the full conversion path, but gives weighted credit to touchpoints as they get closer in time to a conversion. |
How it’s used | This model helps you understand how to value the multiple touchpoints that helped lead to a conversion, but gives the most recent touchpoints more credit. Compared with a last-touch or last-click model, time decay better reflects how all touchpoints lead to a conversion in a way that may more realistically represent how customers interact with and consider ads as they get closer to converting. To understand and credit the full conversion path, consider even credit and positional attribution models. |
How it’s calculated | This model is a rules-based multi-touch attribution model. It decreases the amount of credit given to each touchpoint by half after a set amount of time, with more credit given to the most recent touchpoints. This model is offered in two configurations, 1 day and 7 day half-life. A longer half-life leads to a more even distribution of credit over time, whereas a shorter half-life distributes a majority of credit to the most recent touchpoints. |
Example | Choosing a one day half-life means that touchpoints that happened one day before the conversion get 50 percent of the credit, and touchpoints that happened two days before get 25 percent of the credit. |

Time decay
The data-driven attribution model assigns fractional credit for a conversion to Meta touchpoints based on their estimated incremental impact. This is a statistical-based model developed by Meta and updated periodically. It has coefficients that can vary from advertiser to advertiser, industry to industry and analyst to analyst. All other models, last click, last touch, even credit, positional and time decay, are rule-based models, which follow a set of finite and transparent rules and a predetermined formula.
Because this model uses learnings from actual data observations and is trained on randomized control experiments, it can more accurately measure the incremental value of your marketing efforts. This model is available on Facebook, Instagram, Audience Network and Messenger only.
![]()
Simple linear regression
![]()
Multiple linear regression
![]()
Logistic regression
![]()
T-Test
Based on your hypothesis, determine which statistical analyses are required. We will focus on simple linear regression and multiple linear regression.
![]()
ANOVA
![]()
Correlation
![]()
F-Test
![]()
Chi-Square Test
Regression analysis is a tool that helps you make inferences and predictions about data. It’s an observational method that can help you identify correlative results in the data. It also contains metrics that help you understand the accuracy of its predictions.
You can run regression analysis in R, Python and many other programming languages and data analytics tools.
There are several types of regression analyses. The type of analysis you choose depends upon the business context. For example, logistic regression can be helpful when the dependent variable has a predetermined set of possible values or can only be a true or false value. Linear regression may be more helpful to analyze data where there are no restrictions on the value of the dependent variable, for example, return on ad spend.
Linear regression analysis helps to assess the strength of the relationship between a dependent variable and an independent variable. It can also help determine whether the relationship between a set of independent variables follows a pattern.
An independent variable is a value that changes as a result of independent factors outside of your data set. A dependent variable is a value that changes because of a hypothesized change in an independent variable. With regression analysis, you can test this hypothesis.
Simple linear regression
Simple linear regression analyzes the relationship between one dependent variable and one independent variable.
For example, a data analyst at a fictitious electronic manufacturer, Axion, uses simple linear regression to analyze the relationship between the number of ad impressions and the value of Axion sales in a given period. The number of ad impressions is the independent variable, and the values of sales is the dependent variable.
Note: Axion is a fictitious business designed by Meta. Any similarities to content produced by real-life businesses aren't intentional. This example is for illustrative purposes only.
Multiple linear regression
Multiple linear regression analyzes the relationship between one dependent variable and multiple independent variables.
For example, the marketing team at Axion has a hypothesis that people in North America are more likely to buy electronics on days when the weather is cold. To analyze the relationship between ad impressions, the outdoor air temperature in a given city and the value of sales in a day, a data analyst uses multiple linear regression.
Scatterplots
A scatterplot is an exploratory data visualization chart. It helps you examine data to identify patterns or show where gaps or outliers might exist in your data. It's often a starting point for data analysis, specifically regression analysis.
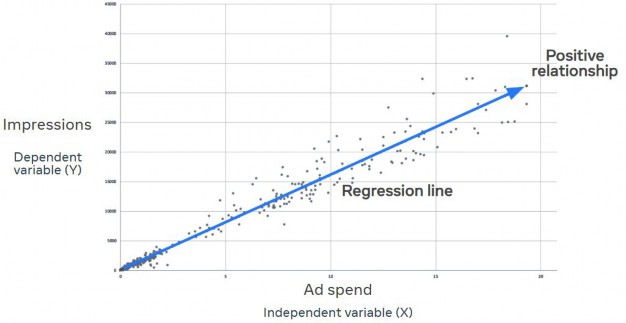
You can use a scatterplot to view the results of a simple linear regression analysis. The independent variable is on the x-axis, and the dependent variable is on the y-axis. The regression line in the middle represents the predicted values of Y given the changes in X.
The scatterplot shows ad impressions on the x-axis and sales on the y-axis. A data analyst can see a positive relationship between ad impressions and sales. The scatterplot shows that in this data set, an increase in ad impressions correlates with an increase in sales.
Regression analysis outputs
People typically perform regression analyses with analysis software, such as R or Python, that read data directly from a database. You can also perform a regression analysis in Excel, but there are limits on the number of data rows that Excel can process.
A typical regression analysis outputs a set of values that provide information about the relationship between the variables and the accuracy of the predictions in the regression model. The constant variable is the rate of change in the dependent variable when there's no change in either of the independent variables.
Some of the output values are useful to help you understand the statistical relationship between variables. Others are useful when you compare models between one another to measure how well the models capture the true relationships between these variables.
Correlation coefficient
The correlation coefficient is the rate of change in the dependent variable per unit change in the independent variable. The correlation coefficient is often known as r.
r always has a value between -1 and 1. An r value close to 1 means that there's a strong positive relationship between the two variables. Conversely, an r value closer to -1 means that there's a strong negative relationship between the two variables.

Example 1
In this first scatterplot chart, the data points are in perfect correlation to the regression line. The value of r in this analysis is 1.
You don't need to learn how to calculate r. Your regression analysis software does this for you. Let's look at some simple examples.

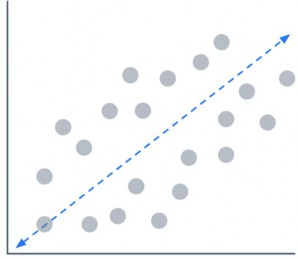
Example 2
In this second chart, the data points are scattered in the direction of the line, but there’s a wide variation between some points and the line.
The value of r in this analysis is 0.3.

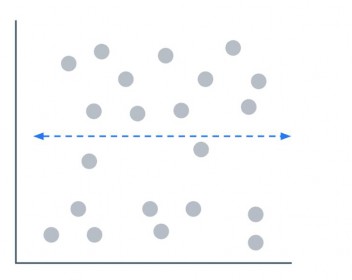
Example 3
In this third chart, the data points are scattered across the entire area of the chart. There is no correlation between these data points.
The value of r in this analysis is 0. The data isn’t suitable for use in a regression analysis.
Positive coefficients and negative coefficients
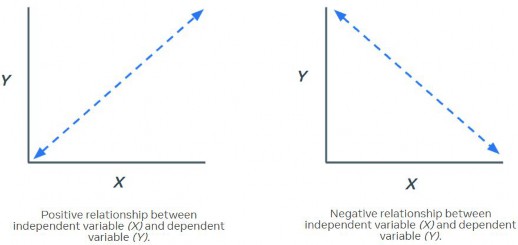
The sign of each coefficient indicates the direction of the relationship between the independent variable and the dependent variable.
A positive coefficient for an independent variable means that an increase in the independent variable correlates to an increase in the dependent variable. A positive coefficient creates an upward diagonal line on a scatterplot.
Similarly, a negative coefficient means that an increase in the independent variable correlates to a decrease in the dependent variable. This negative relationship creates a downward diagonal line on a scatterplot.
Analyze the effect of a single independent variable
Let's look at a simple linear regression analysis prepared by a data analyst. The purpose of this analysis is to examine the correlation between ad impressions and product sales. The marketing team would like to predict future sales based on the number of ad impressions.
The data analyst uses a scatterplot to present the results of his simple linear regression analysis.
The scatterplot shows ad impressions on the x-axis and sales on the y-axis. A data analyst can see a positive relationship between ad impressions and sales. The scatterplot shows that in this data set, an increase in ad impressions correlates with an increase in sales.
Axion example
As the marketing team at Axion creates their media budget for their new campaign, they want to estimate how increases in media spending will affect product sales.
Meanwhile, the product management team wants to estimate the effects of a proposed increase in product prices. The business could make more money with higher prices, but the team knows there's a risk that increased prices may lead to decreased sales.
Both teams ask the data analyst for data analyses to help guide their decisions, so the analyst uses a multiple linear regression model. This table shows the regression analysis output. This is fictitious data, so some of the values you see here could be much higher or lower than you'd see in the real world.
Variable | Coefficient | Standard error | t-stat | p-value |
Constant | 0.000565 | 0.167903 | 0.033501 | 0.9734 |
Media Spend | 1.031918 | 0.006649 | 155.1976 | 0.000 |
Prices | -0.0483421 | 0.041780 | 11.57056 | 0.000 |
Take a closer look at the coefficient column. The constant, which is the rate of increase in sales without a change in media spend or prices, is 0.000565.
The media spend coefficient is positive, which means the model predicts that for each additional unit of media spend, product sales should increase by 1.031918. In the model, this means that for every additional $100 the Axion team spends on media, they can expect to sell approximately 1.031918 more units of the new television.
The price coefficient is negative, which means the model predicts that for each unit of increase in prices, sales of the television should decrease by 0.483421 units.
Find the best fit line
Regression analysis is only effective when there's a linear relationship between the value of the independent variable and the value of the dependent variable. Some outlier values are acceptable, but they might reduce the accuracy of the model.
The best fit line minimizes the distance between data points and the line. Let's examine two examples of best fit lines.
In this chart below, there's a linear relationship between the data points. This data is suitable for regression analysis.
In this chart below, there are clusters of values in different locations. The regression line ignores some of the values. You can't ignore values in your data set though, because the results of your analysis would be inaccurate.
Your regression analysis software can help you to automatically find the best fit line. You can look at the positions of the data points on the chart to determine if there is a linear relationship between the values.
Least-squared correlation
The least squares method, also known as the residual error method, is the most common way to identify the best regression line.
When you run a least squares regression model, the model calculates two values (the intercept value and the slope value) that minimize residual errors. The lower the residual error, the better the model.
You don't have to manually calculate these values. Your regression analysis software performs the calculations for you.
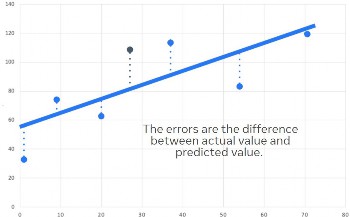
Slope and intercept
Here's a scatterplot with six data points and a regression line. The regression line shows the predicted number of conversions in relation to ad spend value, which is the independent variable. The number of conversions is the dependent variable, which the model predicts to increase when ad spend increases.
Your regression analysis software populates values into an equation when it calculates the regression line. You can use the regression line equation to predict values along the line, including values beyond the range shown on the chart.
The regression line equation is Y = a + bX.
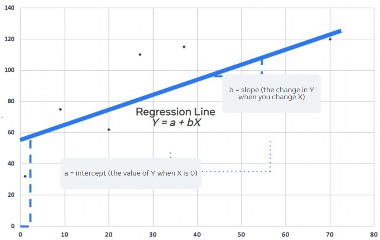
Y is the number of conversions, as the y-axis of the chart shows. X is the value of ad spend, as the x-axis of the chart shows.
a is the intercept value, which is the value of Y when X is 0. The intercept on this chart is 55. In business terms, this could mean that 55 conversions occur each day when ad spend is $0.
b is the slope value, which is the change in Y when you change one unit of X. In the equation, bX means b multiplied by X. The slope on this chart is the increase in conversions per dollar of ad spend. In this simple example, we can interpret the slope value as the coefficient for X.
Introduction to R-squared
R-squared (which can also be written as R2) is the value that tells you how accurate your model is. Simple linear regression models use R-squared and multiple linear regression models use adjusted R-squared.
R-squared tells you how much of the change in the dependent variable was related to the change in the independent variable. Most regression models don't show an exact correlation between the independent variable and the dependent variable. There are always residual errors, which are changes related to influences outside of your model.
Adjusted R-squared considers the correlation between multiple independent variables and the value of the dependent variable. Just like R-squared, it tells you how much of the change in the dependent variable was related to the change in the independent variables.
You don't need to learn the formula for adjusted R-squared right now. The adjustment is a calculation your regression analysis software can perform for you
Use R-squared to determine model accuracy
Let's return to our example scenario of the fictitious electronics manufacturer, Axion.
The Axion data analyst has run a multiple linear regression model to analyze the effect media spend and price increases have on sales of the new Axion television. The data analyst needs to provide evidence to the product and marketing teams that the model provides accurate predictions based on their business data. An accurate model is considered to be a good fit for the data.
Dependent variable: LOG(SALES)
Method: Least squares
Sample: 01-2016 52-2018
Included observations: 150
R-squared: 0.99853
Adjusted R-squared: 0.998515
S.E. of regression: 0.01685
F-stat: 14979.05
P(F-stat): 0.000000
Variable | Coefficient | Standard error | t-stat | p-value |
Constant | 0.000565 | 0.167903 | 0.033501 | 0.9734 |
Media Spend | 1.031918 | 0.006649 | 155.1976 | 0.000 |
Prices | -0.0483421 | 0.041780 | 11.57056 | 0.000 |
This is a multiple linear model, meaning a model with multiple independent variables, so the data analyst looks at the adjusted R-squared value. Adjusted R-squared for this model is 0.998515. This means that the changes in the independent variables can explain approximately 99% of the change in the dependent variable. This R-squared value indicates that the model is a good fit for the business data.
Introduction to standard error
The standard error estimates the standard deviation of the coefficient. Standard deviation is the measure of how close the values in a data set are to the mean value. The coefficient is the predicted change in the value of the dependent variable per unit change in the independent variable.
You can use the standard error to understand how precisely the model estimates the value of the coefficient. The smaller the standard error is, the more precise the estimate for that coefficient is as well.
Standard error and the precision of a model
Let's return to our example scenario of Axion, a fictitious electronics manufacturer. The data analyst has run a multiple linear regression model to analyze the effect of media spend and price increases on sales of the new Axion television. His hypothesis states that media spend has a statistically significant influence on sales.
The table below shows the outputs the regression analysis software the analyst uses has generated. This is fictitious data, so some of the values you see here could be much higher or lower than you'd see in the real world.
Variable | Coefficient | Standard error | t-stat | p-value |
Constant | 0.000565 | 0.167903 | 0.041780 | 0.9734 |
Media Spend | 1.031918 | 0.006649 | 155.1976 | 0.000 |
Prices | 0.0483421 | 0.041780 | 11.57056 | 0.000 |
The output shows the standard error for each coefficient. The media spend variable has a low standard error, which means the model is a relatively precise measure for the change in sales per unit of media spend.
Introduction to t-stat and p-value
The t-stat is the coefficient divided by the standard error. The model uses the t-stat to calculate the p-value, which is sometimes referred to in a model as the probability or 'prob.'
The p-value is important, because it tells you whether the coefficient is statistically significant. Statistical significance helps you to understand the strength of the relationship between the independent variable and the dependent variable. You can interpret the p-value as the confidence level.
For example, to have a confidence of 95%, we use a p-value of (1 - 0.95) = 0.05.
When the p-value is lower than 0.05, there's generally sufficient evidence that the coefficient prediction is statistically significant, and you can consider the independent variable to be a reliable predictor for the dependent variable.
If the p-value is greater than 0.05, it could indicate that the independent variable isn't a reliable predictor for the dependent variable.
value and statistical significance
In our example scenario, the data analyst looks at the p-values in the regression analysis output to determine if the model provides evidence that proves his hypothesis. The hypothesis states that media spend is a statistically significant predictor of sales.
Variable | Coefficient | Standard error | t-stat | p-value |
Constant | 0.000565 | 0.167903 | 0.041780 | 0.9734 |
Media Spend | 1.031918 | 0.006649 | 155.1976 | 0.000 |
Prices | 0.0483421 | 0.041780 | 11.57056 | 0.000 |
In this model, the independent variables, media spend and prices each have a p-value lower than 0.05. This means that both independent variables are statistically significant. The analyst now knows that the media spend coefficient is a reliable predictor of sales when there's a change in media spend. He also now knows that the same is true for product prices.
The constant p-value is greater than 0.05, which means that it’s not statistically significant. A high constant p-value could occur, for example, with a new product that doesn’t yet have established baseline sales. The new television model is a recent addition to the Axion product range, so there's limited historical sales data available.
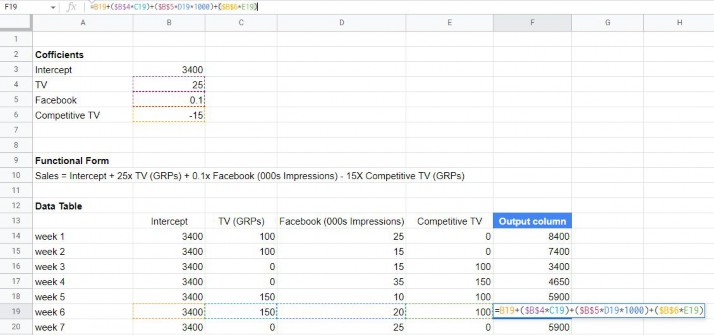
Given a set of coefficients, the functional form of a model and a data table, calculate the output column. See an example of how it could be calculated below. Note that this sample data is independently compiled and not the output delivered from an actual test.
Because not all measurement tools use the same methodology, you may have to reconcile results across different measurement solutions. To do that, ask yourself:
What data input is used? Identify which events are included in the data, whether they are accurately monitored and how data is collected across devices.
What time frames are used?
What conversion window is applied?
What attribution window is used?
What measurement methodology is used?
Does it use an observational method, like attribution or marketing mix modeling? Or an experimental method, like lift studies?
Does it include the use of historical data or data from similar campaigns or industries?
Examples of reconciling differences across measurement solutions | |
Platforms such as YouTube or Twitter may define a video view, or thruplay, differently, so it’s important to consider what counts as a video view. | The standard Ads Manager attribution window is set to 1-day view and 28-day click, but in Google Ads conversion reporting is 30 days, so attribution windows need to be reconciled before analysis. |
Data | Data | |
34 | ||
56 | Mean | 65 |
112 | Standard error | 7.63201278 |
78 | Median | 56 |
65 | Mode | 55 |
44 | Standard deviation | 29.5586584 |
55 | Sample variance | 873.714286 |
75 | Kurtosis | -0.9432981 |
23 | Skewness | 0.18550307 |
110 | Range | 92 |
98 | Minimum | 20 |
97 | Maximum | 112 |
53 | Sum | 975 |
55 | Count | 15 |
20 | ||
To kick off a data analysis, make a table that breaks down summary statistics. Summary statistics give a quick and simple description of the data. They can include mean, median, mode, minimum value, maximum value, range and standard deviation. For example:
Breaking down a summary statistic is the first step of most analyses. After, you can perform additional analyses, such as lift calculations. Lift results include information about the results your ads caused, including the metrics:
Lift % | Indicates how much your ads increased the rate at which people converted (as defined by the conversion events you chose when you created the test). For example, if your ads increased the conversion rate by 50%, that could mean that you got 100 conversions during the test without ads and 150 with them. That would mean that they got you 50 additional conversions. |
Lift % calculations | Divide the number of additional conversions by the number of conversions you would’ve gotten without ads and multiply that by 100 to calculate Lift%. In this case, that would be:
|
Conversion lift | The number of conversions that wouldn’t have happened without your ads. |
Confidence | A percentage that represents how confident Meta is that your ads caused conversion lift. Results that Meta is at least 90% confident in are considered reliable. Meta’s testing methodology includes thousands of simulations based on your test. If your ads caused conversion lift in 80% of Meta’s simulations, Meta would be 80% confident that your ads caused conversion lift during the test. |
Raw data for analysis often exists in databases and other sources and needs to be retrieved. Data that exists in various databases or data tables needs to be combined and filtered to extract what is suitable to enter into an analysis.
A JOIN clause combines rows from two or more tables, based on a related column between them.
Inner join | Returns records that have matching values in both tables. |
Left join | Returns all records from the left table and the matched records from the right table. |
Right join | Returns all records from the right table and the matched records from the left table |
Full join | Returns all records when there is a match in either left or right table. |
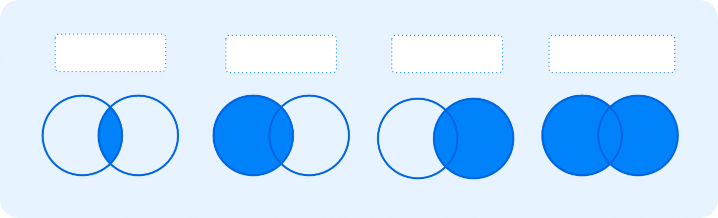
Inner join
Left join
Right join
Full outer join
table 1
table 2
table 1
table 2
table 1
table 2
table 1
table 2
Read SQL Joins for examples about how to apply the different JOINs.
Imagine a retail analyst has a database that contains comprehensive data for stores of all sizes from the last 5 years, but they only want to analyze data from stores in California that are larger than 500 square feet and from the last 12 months. The analyst queries a database to pull such data using SQL and then conducts some of the analysis, including visualizing the data, creating descriptive statistics and running a form of statistical analysis such as regression. An appropriate JOIN based on data structure would combine data from multiple tables.
Data visualization is a graphic representation of data. It involves producing images that communicate relationships among the represented data to viewers. This communication is achieved through the use of a systematic mapping between graphic marks and data values to create a visualization. While this is not required, it’s recommended as a good practice for analysts.
![]()
Heat map
Jan Feb Mar Jul Aug

All Placements
Feed
In-stream video
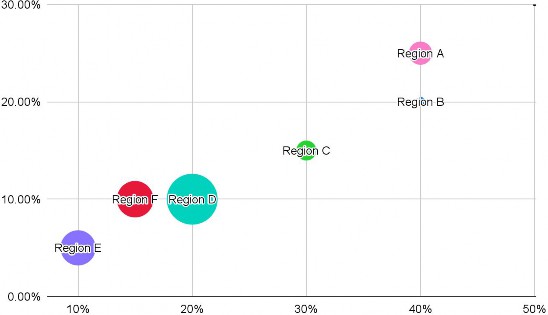
![]()
Bubble chart
Explore Stories

Line graph
![]()
Scatter plot
![]()
Bar chart
Generate insights

Data-driven insights can inform the next steps in your marketing strategy. Through your analysis, you may have learned which marketing actions, campaigns and campaign strategies had a positive effect. You can use these insights to make media planning and buying decisions or decide on your future campaign strategies.
After completing an experiment and analyzing marketing performance across multiple tools, it’s time to draw insights to develop media recommendations. Contextualize the results by taking the following actions:
Combine campaign insights with research. | Identify a common thread across studies, platforms and/or channels. |
Leverage all insights and research available to inform your marketing recommendations. | For example, an advertiser ran a series of Conversion Lift tests against different strategies. Results showed that including video creative in addition to static creative drove incremental results across all strategies. Because of this, the advertiser considers prioritizing the development of video assets when new creative is developed. |
Insights can be captured from the following sources.
Campaign performance | For every ad, you can view performance insights in Ads Manager. This data includes how many people saw your ad or clicked on it and the amount you spent. Meta Business Suite is another tool you can use to extract insights. It enables you to view details about performance, such as trends, activity on the content you share and more information about your audience. |
From business data | Business systems, such as sales order systems and CRM systems, can provide valuable source data for marketing insights. This data can help generate insights about sales cycles, best performing products and customer preferences. You can also learn about customer demographics at an aggregated level and use that information to guide audience selections for future campaigns. |
From Meta Foresight | Meta Foresight is a resource that can help you understand consumer behavior, create more effective marketing strategies and transform how your business reaches people. On Meta Foresight, there is:
|
From third-party resources | There are a variety of free and paid online hubs where you can gather more insights and research to flesh out your story. |
Insights should be based on data and can incorporate a variety of dimensions, including but not limited to:
Dimension | Example |
Budget | Doubling the campaign budget made ROAS less efficient. |
Inter-channel allocation | A brand sees that overall incremental return on ad spend increases by 10% when running with a media allocation of 60% on channel A and 40% on channel B, vs. 50% on channel A and 50% on channel B. |
Dimension | Example |
Intra-channel allocation | A brand sees that overall incremental return on ad spend increases by 10% when allocating 30% of their budget to upper-funnel campaigns, versus allocating 50% of their budget to upper-funnel campaigns. |
Reach | Reach across both TV and Meta technologies has more impact on in-store purchases compared to reach on each platform alone. |
Bid strategy | Utilizing cost cap drove business outcomes with the most efficient returns compared to target cost. |
Buying strategy | ROAS was more efficient when using reach and frequency buying instead of auction buying. |
Audiences | Targeting women ages 18-24 brought more value than targeting women ages 18-55. Note:
|
Placement | Selling products is more effective on Instagram and Facebook combined, as compared to Facebook alone. |
Creative | Using Creative A outperformed Creative B. |
Test duration | Running a four-week campaign resulted in better outcomes than a two-week campaign. |
Approach your research with your proven or disproven hypothesis in hand, and let that hypothesis focus your research. Interpret the significance of your test results using relevant metrics, such as:
P-value | The probability of obtaining test results at least as extreme as the results actually observed during the test, assuming that the null hypothesis is correct.
|
R2 |
|
Explain why the hypothesis was true or false by contextualizing the data, determining the caveats and acknowledging that the consumer path is complex. Stay clear on the how and why of the data, as well as the tools and research that yielded it.
Evaluate the success of a measurement approach by determining whether it adequately measured your KPIs. There are issues that could come up that would prevent you from adequately measuring your KPIs, such as:
Dilution during a test
Not accounting for offline transactions during a Conversion Lift test
Insufficient statistical power
Contamination between the test and control cells of an experiment
Adjust the measurement approach if the original plan failed to meet the intended measurement goals by considering either testing a new hypothesis or retesting a hypothesis. Retest a new hypothesis if the test results were contaminated, the test results were inconclusive or you want to validate the results.
The p-value of a statistical test showed that there was insufficient evidence to reject the null hypothesis, but the analyst uncovered a data issue with the pixel that led to conversion volume being drastically lower than it should have been. During a re-test, the team needs to ensure that the proper data is flowing into the experiment so that the results are as accurate as possible.
Make data-driven recommendations

Measurement is an iterative process. As your marketing strategy evolves, it’s important to continue to test different variables to determine which strategy is most effective at driving results.
It’s important to know how the ad delivery system works so you can make effective recommendations, such as adjusting your bid strategy or targeting.
Meta gives you many opportunities to show ads. The delivery system determines which ad is shown using the following three components:
Ad auction |
|
Performance optimization |
|
Advertiser controls | Strategic levers to consider before launching a campaign including bid, budget, audience, creative, placement and optimization |
To ensure that all ads are evaluated in a consistent way and the winning ad maximizes value for both people and businesses, Meta assigns a total value to every ad that competes in the auction. The total value is based on the amount you bid, how likely it is that showing your ad to a person will lead to your desired outcome and ad quality, along with how relevant your ad is to the targeted individual. The ad with the highest total value wins the auction for the targeted individual.
Maximize advertiser value | Optimize the customer experience | = Total value |
Advertiser bid x estimated action rates | + Ad quality |
Advertiser bid | The amount the advertiser is willing to pay to achieve their desired outcome, such as a conversion. A bid can be the same as or less than a budget, which is the total amount of money an advertiser is willing to spend through the life of a campaign. |
Estimated action rates | The probability that showing an ad to a person leads to the advertiser’s desired outcome. The desired outcome is aligned with the advertiser’s campaign objectives. |
Ad quality | A measure of the quality of an ad and how interesting a person will find it. |
There are two main buying types for Meta ads:
Auction | Reach and frequency |
Auction buying offers more choice, efficiency and flexibility, with less predictable results. Ads can be placed across Facebook, Instagram, Messenger and Audience Network. | Reach and frequency buying lets you plan and buy your campaigns in advance, with predictable ad delivery and more control over your frequency settings. |
The performance optimization system uses machine learning to predict which ad auctions give you the best value for your money. Pacing is a budget optimization process that ensures your budget is spent as evenly as possible over the lifetime of your ad set. It helps prevent you from spending your budget too quickly on inefficient results. Pacing enables flexibility to help get you the best available results for your goals by enabling adjustments.
Budget pacing | Bid pacing |
The aspect of pacing where we may increase budget if there’s an opportunity to get many optimization events with costs aligned with your bid strategy | The aspect of pacing where we adjust your bid or which auctions we enter based on how much budget and time are left for your ad set. |
There are five bid strategies to choose from. You can also choose not to enter a cost control.
Highest volume | Select the highest volume bid strategy if you want to maximize delivery and conversions you can get from your budget. This bid strategy is best for spending your budget as efficiently as possible. However, the cost of your ad results will fluctuate more, as changes are made to get the highest volume. For example, if auction competition decreases, the cost of your ads may go down and if auction competition increases, the costs of your ads may go up. |
Highest volume optimized for value | Select the highest volume optimized for value bid strategy if you want to spend the entire budget by the end of the schedule of an ad set while maximizing the amount of value you get from purchases. This automated bid strategy is available for ad sets optimizing for purchase value. Value optimization uses machine learning to predict how much ROAS you may generate for a business over a one- or 7-day window. This prediction is then used to bid for your highest value customers. By bidding more for people who are likely to spend more, you can maximize the ROAS for your campaigns. |
Cost per result goal | Select the cost per result goal bid strategy if you want to maximize cost-efficiency and need to keep cost within a specific threshold. This bid strategy enables you to provide a benchmark cost for the results you care about. This helps limit your cost per conversion while maximizing the number of conversions. The cost per result goal reflects how much you are paying on average for results. Not all optimization goals are available for cost per result goal. Learn more about best practices for using cost per result goal. |
ROAS goal | Select the ROAS goal bid strategy if you want to keep return on ad spend around an average amount of the course of your campaign, providing you with more command over the value a campaign brings to your business. When you set a ROAS goal, we’ll try to deliver against that over the campaign’s lifetime, dynamically bidding as high as needed to maximize results. To use this bid strategy, you'll need to optimize your ad set for purchase value. |
Bid cap | Select the bid-cap bid strategy if you want to set a maximum bid across auctions and reach as many people as possible at that bid. This bid strategy maximizes volume at specified maximum bid and can increase competitiveness against other advertisers targeting similar audiences. Bid controls are less flexible, which means they're more likely to constrain delivery than cost controls because the bid cap limits bids in every auction. |
These bid strategies are divided into three categories. These are spend-based bidding, goal-based bidding and manual bidding.
Spend-based bidding | Goal-based bidding | Manual bidding |
Focus on spending your full budget and getting the most results or value possible. | Set a cost or value you want to achieve. | Control how much you can bid across ad auctions. |
Use the table below to learn more about the bid strategies.
Spend-based bidding | Goal-based bidding | Manual bidding | |||
Highest volume | Highest volume optimized for value | Cost per result goal | ROAS goal | Bid cap | |
Budget goals |
|
|
|
|
|
Considerations |
|
on purchase value to be passed to Meta. |
|
|
|
Adjustments can be made on the following dimensions to help improve your ad performance:


Campaign objectives
Budget Placement


Audience Bid Creative
Once you have assembled and contextualized your data, insights and research, compose a holistic story, including recommendations for future marketing efforts. Make your recommendations using insights that are anchored to the levers you can pull to maximize performance. For example, given a set of insights, determine the optimal media buy adjustments by considering:
Short-term impact | Long-term impact | Inter-channel allocation | Intra-channel allocation |
If the goal is to decrease cost per action, increase ROAS or both | If the goal is to increase brand awareness, brand equity or both | How you allocate media budget between different marketing channels, such as Meta, Search and Video | How you allocate budget against different marketing tactics within one channel, such as audiences, creative and optimization |
Cross-channel | Single-channel | |
What it can do | Enables advertisers to use the same KPI to measure performance across distinct marketing channels | Enables advertisers to measure different placements and strategies within Meta products and technologies |
Available solutions |
Can measure performance between channels. Consider which metrics you use to compare performance between these channels, such as cost per action, return on ad spend, brand metrics and reach. | Can test different variables including:
|
It’s important to have a test-and-learn mind-set. Testing is a science and an art. After adopting your findings, identify new opportunities to test and learn from:
Retest your | Repeat the same | Use your | Determine | Evaluate new |
hypothesis. | test or a similar one. | conclusions to inform a new test | potential new variables for | approaches to test the same |
for a new hypothesis. | iterative testing. | variable using either an A/B test | ||
or a lift | ||||
methodology. |
Historically, an advertiser has only allocated budget targeting previous customers and has seen this audience lead to a 10x ROAS based on their last touch model. However, they have a hypothesis that many of these customers are already loyal and would have converted without seeing any ads. They decide to use a different method, lift, to measure the same variable, audience, and determine if this strategy is leading to a significant lift in sales.
Given a situation, recommend new approaches for future analyses. You can:
Address data blind spots. | Isolate which variables and strategies are most effective at achieving outcomes. | Develop a strategy to measure cross-channel performance. | Consider depth, breadth and scope. |
An advertiser runs a multi-cell test to determine if allocating budget against a Lookalike audience and a remarketing audience can lead to a higher lift than just targeting a remarketing audience. The lift test estimates that the Lookalike and remarketing audiences drove a significantly higher lift compared to solely targeting the remarketing audience. The insight is that allocating budget against an acquisition audience can increase incremental outcomes.
The new opportunity is to allocate budget against an ever more broad, prospective audience and re-run the measurement test to determine if a broader audience can result in even more incremental outcomes.
Your insights, gathered from campaign results, business data and relevant research, enable you to develop actionable recommendations for future campaigns. You may need to gain approval from business stakeholders, in particular those who manage budgets, before you implement your recommendations.
When you present your recommendations, speak in the same terms as your stakeholders and think about how to tell a compelling story.
Keep the needs of your stakeholders in mind. Consider what you want them to know, feel and do. This helps you communicate in ways that they understand. Use only the most relevant facts from your gathered insights.
Know
To start your presentation with stakeholders, first restate your hypothesis, then present evidence that proves it.
Introduce stakeholders to the subject matter with audience and market insights from Meta Foresight and other sources.
Consider evidence you might include that's specific to the brand, for example, results from tests and experiments, such as Brand Lift studies.
Glossary

Acronym | Term | Definition |
A/B test | A test that enables you to conduct a controlled experiment comparing multiple ad sets to see which performs the best. | |
ad quality | A calculated value determined by your ad quality along with how relevant your ad is to the chosen individual. | |
Advanced matching | A Meta Pixel feature that allows websites to pass additional site-visitor information, such as email addresses or phone numbers. | |
Alternative hypothesis | A hypothesis contrary to the null hypothesis, that there’s a relationship between two measured phenomena or an association among groups. | |
API | Application programming interface | An interface that enables software components to communicate with each other and share data. |
Attribution | A measurement solution that enables you to see which platform, channel, device, ads or content should be credited with a conversion. | |
attribution model | The logic that determines how credit is given to touch- points for a conversion. The attribution model logic can be based on a rule or set of rules or a statistical model. | |
auction (buying type) | An ad buying type wherein you decide that you would like to participate in an ad auction. | |
bid | The price for the outcome you're optimizing for. | |
bid cap | A bid strategy that lets you set a maximum bid to be used in each auction. | |
bid pacing | The part of pacing that adjusts your bid or which auctions to enter based on how much budget and time you have left for your ad set. |
Acronym | Term | Definition |
bid strategy | In Meta Ads Manager and Ads Reporting, a setting you select that helps determine how to spend your budget in alignment with their campaign goals. | |
brand lift | Also known as brand affinity, a metric that gives you insight into people's attitudes towards your brand and brand awareness. | |
budget allocation | The amount of marketing expenditure allotted for each marketing activity. | |
buying type | The method by which you buy ads across Meta technologies. | |
CTR | clickthrough rate | The number of times something is clicked on, divided by the number of times it has been displayed. |
control group | The "unexposed" group of people in a study for which no factors of the test are influenced. It's used as a benchmark to measure the effect of the test. | |
conversion efficiency | How effectively your ads drove the interactions you’re measuring. | |
Conversion Lift | An experiment that uses randomized control trials (RCTs) to measure the number of incremental conversions that happen as a result of ads across Meta technologies. | |
conversion lift | A marketing metric that quantifies the number of additional conversions that result from ads. | |
conversion lift percent | The percent difference in conversions between the people who did and didn’t see your ads during a test. | |
conversion rate | The estimated number of times a link on a web page is clicked, compared with the number of times it’s displayed. | |
conversion window | This enables you to choose what type of conversion information is used when determining who your ads are shown to. | |
cost cap | A bid strategy that enables advertisers to set a maximum average cost per optimization event for an ad set. Meta will keep the average cost as far below that amount as possible, but keep showing ads until it’s reached. |
Acronym | Term | Definition |
CPC | cost per click | The cost to the advertiser each time an ad is clicked. |
cost per result | The cost to you each time an action is taken because of your ad. | |
cost per result goal | A bid strategy that enables you to provide a benchmark cost for the results you care about. This limits your cost per conversion while maximizing the number of conversions. The goal amount you provide is an average amount that’s delivered against over the campaign lifetime, while dynamically bidding as high as needed to maximize results. This means that the average cost per result may exceed the set amount. | |
CPM | cost per thousand impressions | The average cost you've paid for 1,000 impressions of your ad, or the average revenue you've received for 1,000 impressions of an ad on your apps or websites. |
cross-channel measurement | Indicates outcomes related to advertising across numerous online or offline channels, such as Meta and television. | |
custom event | A logged action based on a specific action you want audiences to take on your website, app or offline. | |
customer relationship management | A tool that enables businesses to manage customers’ contact information and interactions through the customer life cycle. | |
daily budget | The average amount you’re willing to spend on an ad set or campaign every day. | |
data analysis | A process of inspecting, cleansing, transforming and modeling data with the goal of discovering useful information, informing conclusions and supporting decision making. Data analysis has multiple facets and approaches, encompassing diverse techniques under a variety of names, and is used in different business, science and social-science domains. In today’s business world, data analysis helps businesses to operate more effectively and make decisions more scientific. | |
data source | A tool, connection, piece of code or other object that collects information, such as the Conversions API, Meta Pixel, Facebook SDK and offline conversions. The information can be used for measurement and analysis. |
Acronym | Term | Definition |
dependent variable | A variable whose value depends on that of another. | |
event | A logged action that people take on your website, app or offline, usually used for capturing and measuring ad performance. | |
exact matching | In marketing research, an observational method that examines a group of people exposed to an ad campaign and tries to find a match for each person in the non-exposed group. | |
experimental method | In marketing research, a measurement method that shows different types of ads to separate groups of people in a controlled manner. | |
first-party data | Data a brand collects directly from its customers, such as website activity data and sales data. | |
first-touch attribution | A rule-based attribution model that gives 100% of conversion credit to the first click or visit in a conversion path. If there is no click or visit, then it will credit the conversion to the first impression. | |
GRP | gross rating point | A unit of measurement of audience size for TV advertisements, according to Nielsen. It is used to measure the exposure to one or more programs or commercials, without regard to multiple exposures of the same advertising to individuals. |
highest volume | A bid strategy that can maximize delivery and conversions you can get from your budget. Best for spending your budget as efficiently as possible. However, the cost of your ad results will fluctuate more, as changes are made to get the highest volume. For example, if auction competition decreases, the cost of your ads may go down and if auction competition increases, the costs of your ads may go up. |
Acronym | Term | Definition |
highest volume optimized for value | A bid strategy used if you want to spend the entire budget by the end of the schedule of an ad set while maximizing the amount of value you get from purchases. This automated bid strategy is available for ad sets optimizing for purchase value. Value optimization uses machine learning to predict how much ROAS you may generate for a business over a one- or 7-day window. This prediction is then used to bid for your highest value customers. By bidding more for people who are likely to spend more, you can maximize the ROAS for your campaigns. | |
holdout test | Measures the total conversions caused by your ads across Meta technologies. | |
hypothesis | A supposition or proposed explanation made on the basis of limited evidence. Used as a starting point for further investigation. | |
impression | A single instance of an ad or piece of content, such as a post, appearing on screen. | |
independent variable | A variable whose variation does not depend on that of another. It is the factor that is purposely changed or controlled in order to see what effect it has. | |
ITT | intent to treat | A randomization method that includes all randomized participants in a statistical analysis and analyzes according to the group they were originally assigned, regardless of what treatment (if any) they received. |
inter-channel budget | The allocation of budgets across different channels. | |
KPI | key performance indicator | A metric selected to evaluate the success of a campaign or ad. |
last-touch attribution | A rule-based attribution model that gives 100% of credit to the last ad a person interacted with before a conversion, whether it’s an impression or a click. | |
lifetime budget | The amount you’re willing to spend over the entire runtime of your ad set or campaign. | |
lift solutions | A platform for running experiments on ads across Meta technologies and measuring the incremental impact of ads on business outcomes. |
Acronym | Term | Definition |
liquidity | In the context of machine learning, the concept of allowing Meta to determine the best placement, ad set budget and bids for a campaign. | |
machine learning | A discipline that uses science, information and computer code to automatically predict certain outcomes based on discovered patterns not explicitly programmed. | |
marketing mix modeling | A regression-based analysis that quantifies how much sales and thus return on ad spend can be correlated to each media channel in the mix, for both offline and online channels. | |
Meta Pixel | A piece of code installed on your website that captures website events. | |
multi-cell test | A test that runs multiple experimental designs at the same time. For example, in a two-cell multicell test, cell A has two groups, test and control, and cell B has two groups, test and control. | |
multi-touch attribution | A rule-based attribution model that enables you to credit multiple touchpoints in the customer journey. | |
natural experiment | An observational study in which subjects fall into either the exposed or non-exposed groups based on a naturally occurring event. | |
nested test | An experimental method in which the treatment group for one test is subdivided into a control group and a secondary testing group. | |
null hypothesis | A general statement or default position in inferential statistics that there is no relationship between two measured phenomena or no association among groups. | |
observational method | A way of collecting data through observing. | |
offline conversions | Enables you to measure how much your ads across Meta technologies lead to offline outcomes, such as purchases in your stores, phone orders and bookings. |
Acronym | Term | Definition |
opportunity logging | In an ad’s test period, for the target audience that has an opportunity to see the ad at some specific stage along the delivery funnel (meaning, for a user’s request, that the user has an ad passed at some stage), Meta logs the opportunities (uniquely identified by tags like, userId, studyId, dynamicHoldoutId and isContro) to scribe tables. | |
p-value | The probability of obtaining test results at least as extreme as the results actually observed during the test, assuming that the null hypothesis is correct. | |
parameter | A modifier or custom value assigned to an event for the purpose of adding contextual information for measurement. Parameters are applied to events, and are either predefined parameters applied to predefined events (by Meta) or custom parameters applied to custom events (defined by the user and implemented in their code). | |
propensity score matching | In marketing research, an observational method that assigns everyone in the exposed and nonexposed groups a probability of being exposed. Then people from each group are matched based on their similar probabilities. | |
R² | Also known as the coefficient of determination, R² is the proportion of the variance in the dependent variable that is predictable from the independent variable(s). | |
RCT | randomized control trial | RCTs test a hypothesis by introducing a treatment, studying the effects and determining the impact of your ad. Ultimately, an RCT can help determine how much to spend on each marketing channel in order to maximize results. |
reach | The number of people exposed to a medium at least once during a given period. | |
reach and frequency (buying type) | An ad buying type that enables you to reach an established number of people within an audience at a specified frequency at a fixed price. |
Acronym | Term | Definition |
regression adjustment | In marketing research, an observational method whereby people build a model based on the observed data and use the model to predict the outcome of the campaign based on a set of observed variables, including whether or not people were exposed to the advertising campaign. | |
ROAS | return on ad spend | An economic indicator used to evaluate the effectiveness of ad spend. It is calculated as the ratio of the amount gained or lost relative to the amount invested. |
ROI | return on investment | An economic indicator used to evaluate the efficacy of total media investment, including trade. It is calculated as the ratio of the amount gained or lost relative to the amount invested. |
sales lift | The additional revenue caused by ads in a test, when compared to the test and control groups. | |
SEM | search engine marketing | The practice of marketing a business using paid advertisements that appear on search engine results pages. |
single-cell test | A study with one test group, where group A is shown the ad but group B isn't shown the ad. | |
SDK | Software development kit | A piece of code installed on an app that captures app events. |
statistical attribution model | An attribution model that uses algorithms to determine credit for each touchpoint. | |
TRP | target rating point (buying type) | An ad buying type that enables you to plan and buy video campaigns using Nielsen-verified target rating points (TRPs) on Facebook and Instagram. |
test duration | How long a test runs for, from beginning to end.How long a test runs for, from beginning to end. | |
third-party data | Data collected by a party that does not have a direct relationship with the user (such as DMP). | |
total value calculation | Advertiser bid X estimated action rates + ad quality = total value |
Acronym | Term | Definition |
variable | A quantity or other piece of data that can assume different values. | |
visit | In Attribution, the number of times a person loaded your website from any channel, including paid, direct, organic and untracked channels, as recorded by the Meta pixel or Facebook SDK. |